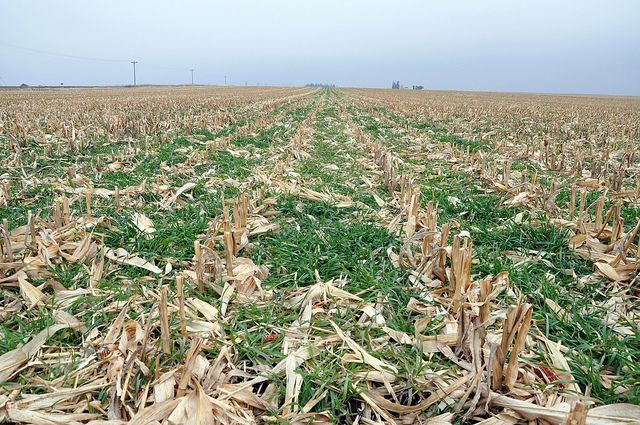
Water quality issues are very important in the State of Iowa. For the last decade, research has been focused on meeting priorities set in the Iowa Nutrient Reduction Strategy. Cover crops have been identified as one potential solution for nutrient management. Cover crops are commonly planted in late summer or early fall around harvest time and terminated in the spring. The goal in planting cover crops is to protect exposed cropland from wind and water erosion during the months when cash crops are not growing.
There is a need by entities in Iowa, including current IowaView partners, to have recent and reliable cover crop data. The goal of this project is to create a repeatable and shareable process for detecting cover crops using publicly available imagery and data products.
Cover Crop ID Tool Handbook – This document provides an explanation of the development of the toolbox and detailed information about each step of toolbox.
Cover Crop ID Toolbox – This zipped file contains the toolbox which can be run on the Esri platform either in ArcMap or ArcPro. Please note the toolbox runs faster in ArcMap (~15 mins) compared to ArcPro (~1 hour).
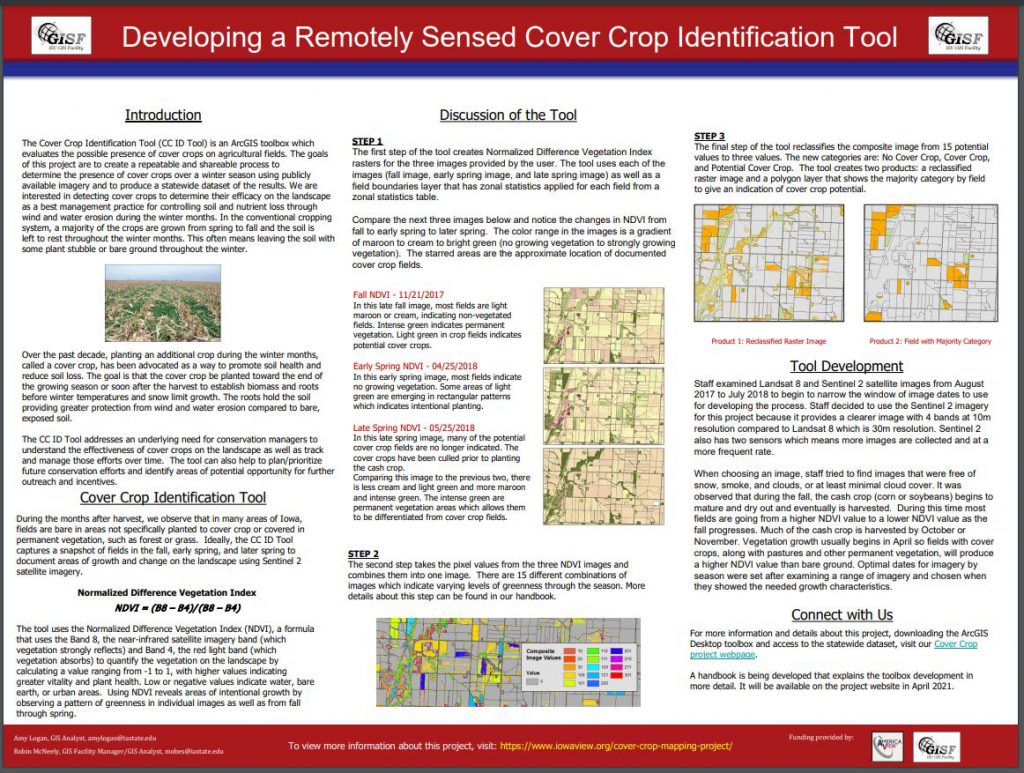
The first year of our research focused on understanding the behavior of cover crops in Iowa, determining a methodology for distinguishing cover crops on the landscape, and developing a model for repetition. The second year goals of the project built upon the first by creating a tool that allows users to input a series of Sentinel 2 images (late fall, early spring, and late spring) and receive an output of potential cover crop locations based on the collective Normalized Difference Vegetation Index (NDVI; this index shows greenness of vegetation on the landscape) value (ranging from -1 to 1, with higher values indicating greater vitality and plant health). The tool was then used to create another deliverable: a statewide map showing potential cover crops.
The tool was developed to operate as three consecutive steps. The first step produced an NDVI image for each of the three Sentinel 2 input images and created a geodatabase for each scene. This geodatabase contains four Sentinel 2 bands, a Normalized Difference Vegetation Index raster for the image, a field boundaries layer that has zonal statistics for each field, and a zonal statistics table.
The toolbox uses the NDVI values to compare pixels in a scene. The project chose NDVI to reveal areas of intentional growth by observing a pattern of greenness from fall through spring. During the months after harvest, it was assumed that fields would be bare in areas not specifically planted to cover crop or covered in permanent vegetation ,such as forest or grass.
The second step examined each pixel of the NDVI images and assigned values indicating low, moderate, and high growth/greenness. Known cover crop planted field data from partner organizations was used to determine the NDVI cutoff values. Then, the values from each of the images were combined to create a composite image with 15 possible values indicating likelihood of cover crop.
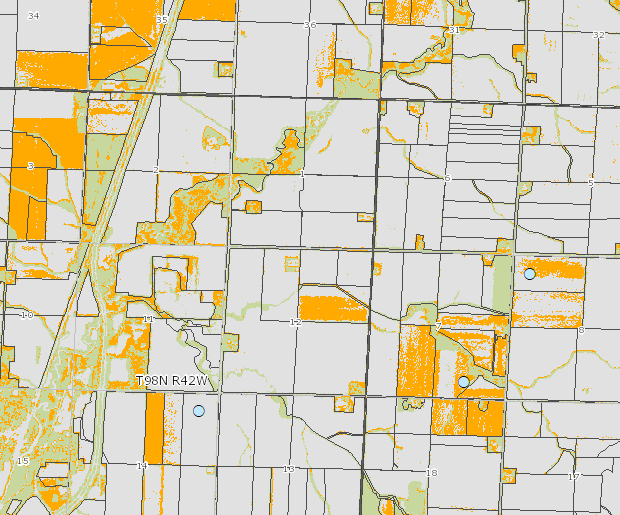
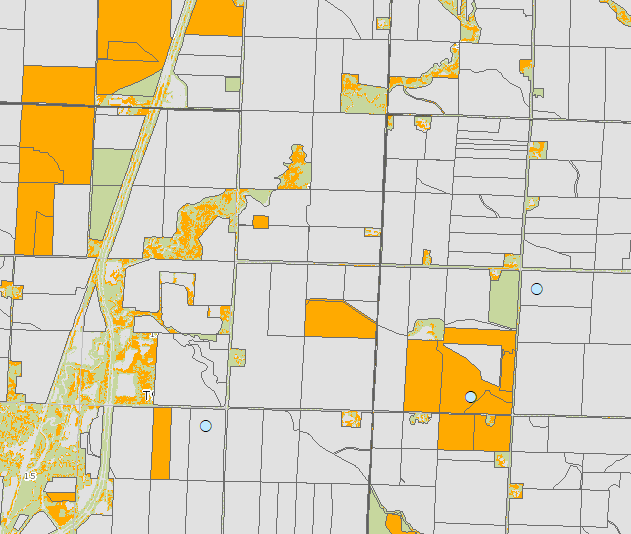
The final step of the tool reclassified the composite image to three categories based on the sequence of NDVI values: No Cover Crop, Potential Cover Crop, and Cover Crop. These raster values were then summarized by field boundary to give a generalized indication of cover crop potential in the field.

Coming soon – an interactive web map and downloadable data.