Backstory
Over the last year, the Iowa State University GIS Facility has hosted several mapping events to teach groups about the opportunities in online mapping, such as the volunteer efforts of the Humanitarian Open Street Map Team (HOT). In July of 2015, a 4-H seminar was hosted on our campus with the theme Dare to Discover. For the event, the GIS Facility hosted two workshops to introduce Iowan youth (high school) to the world of digital mapping and remote humanitarian work.
Description of Task
The intent of the project was to introduce Iowa youth to the components and importance of mapping, and to interest them in its applications. To accomplish this, we developed three goals:
1.) Provide the students with a background in GIS, remote sensing, and digital mapping.
2.) Teach the students about the OSM and HOT programs.
3.) Start the students working in local and humanitarian areas.
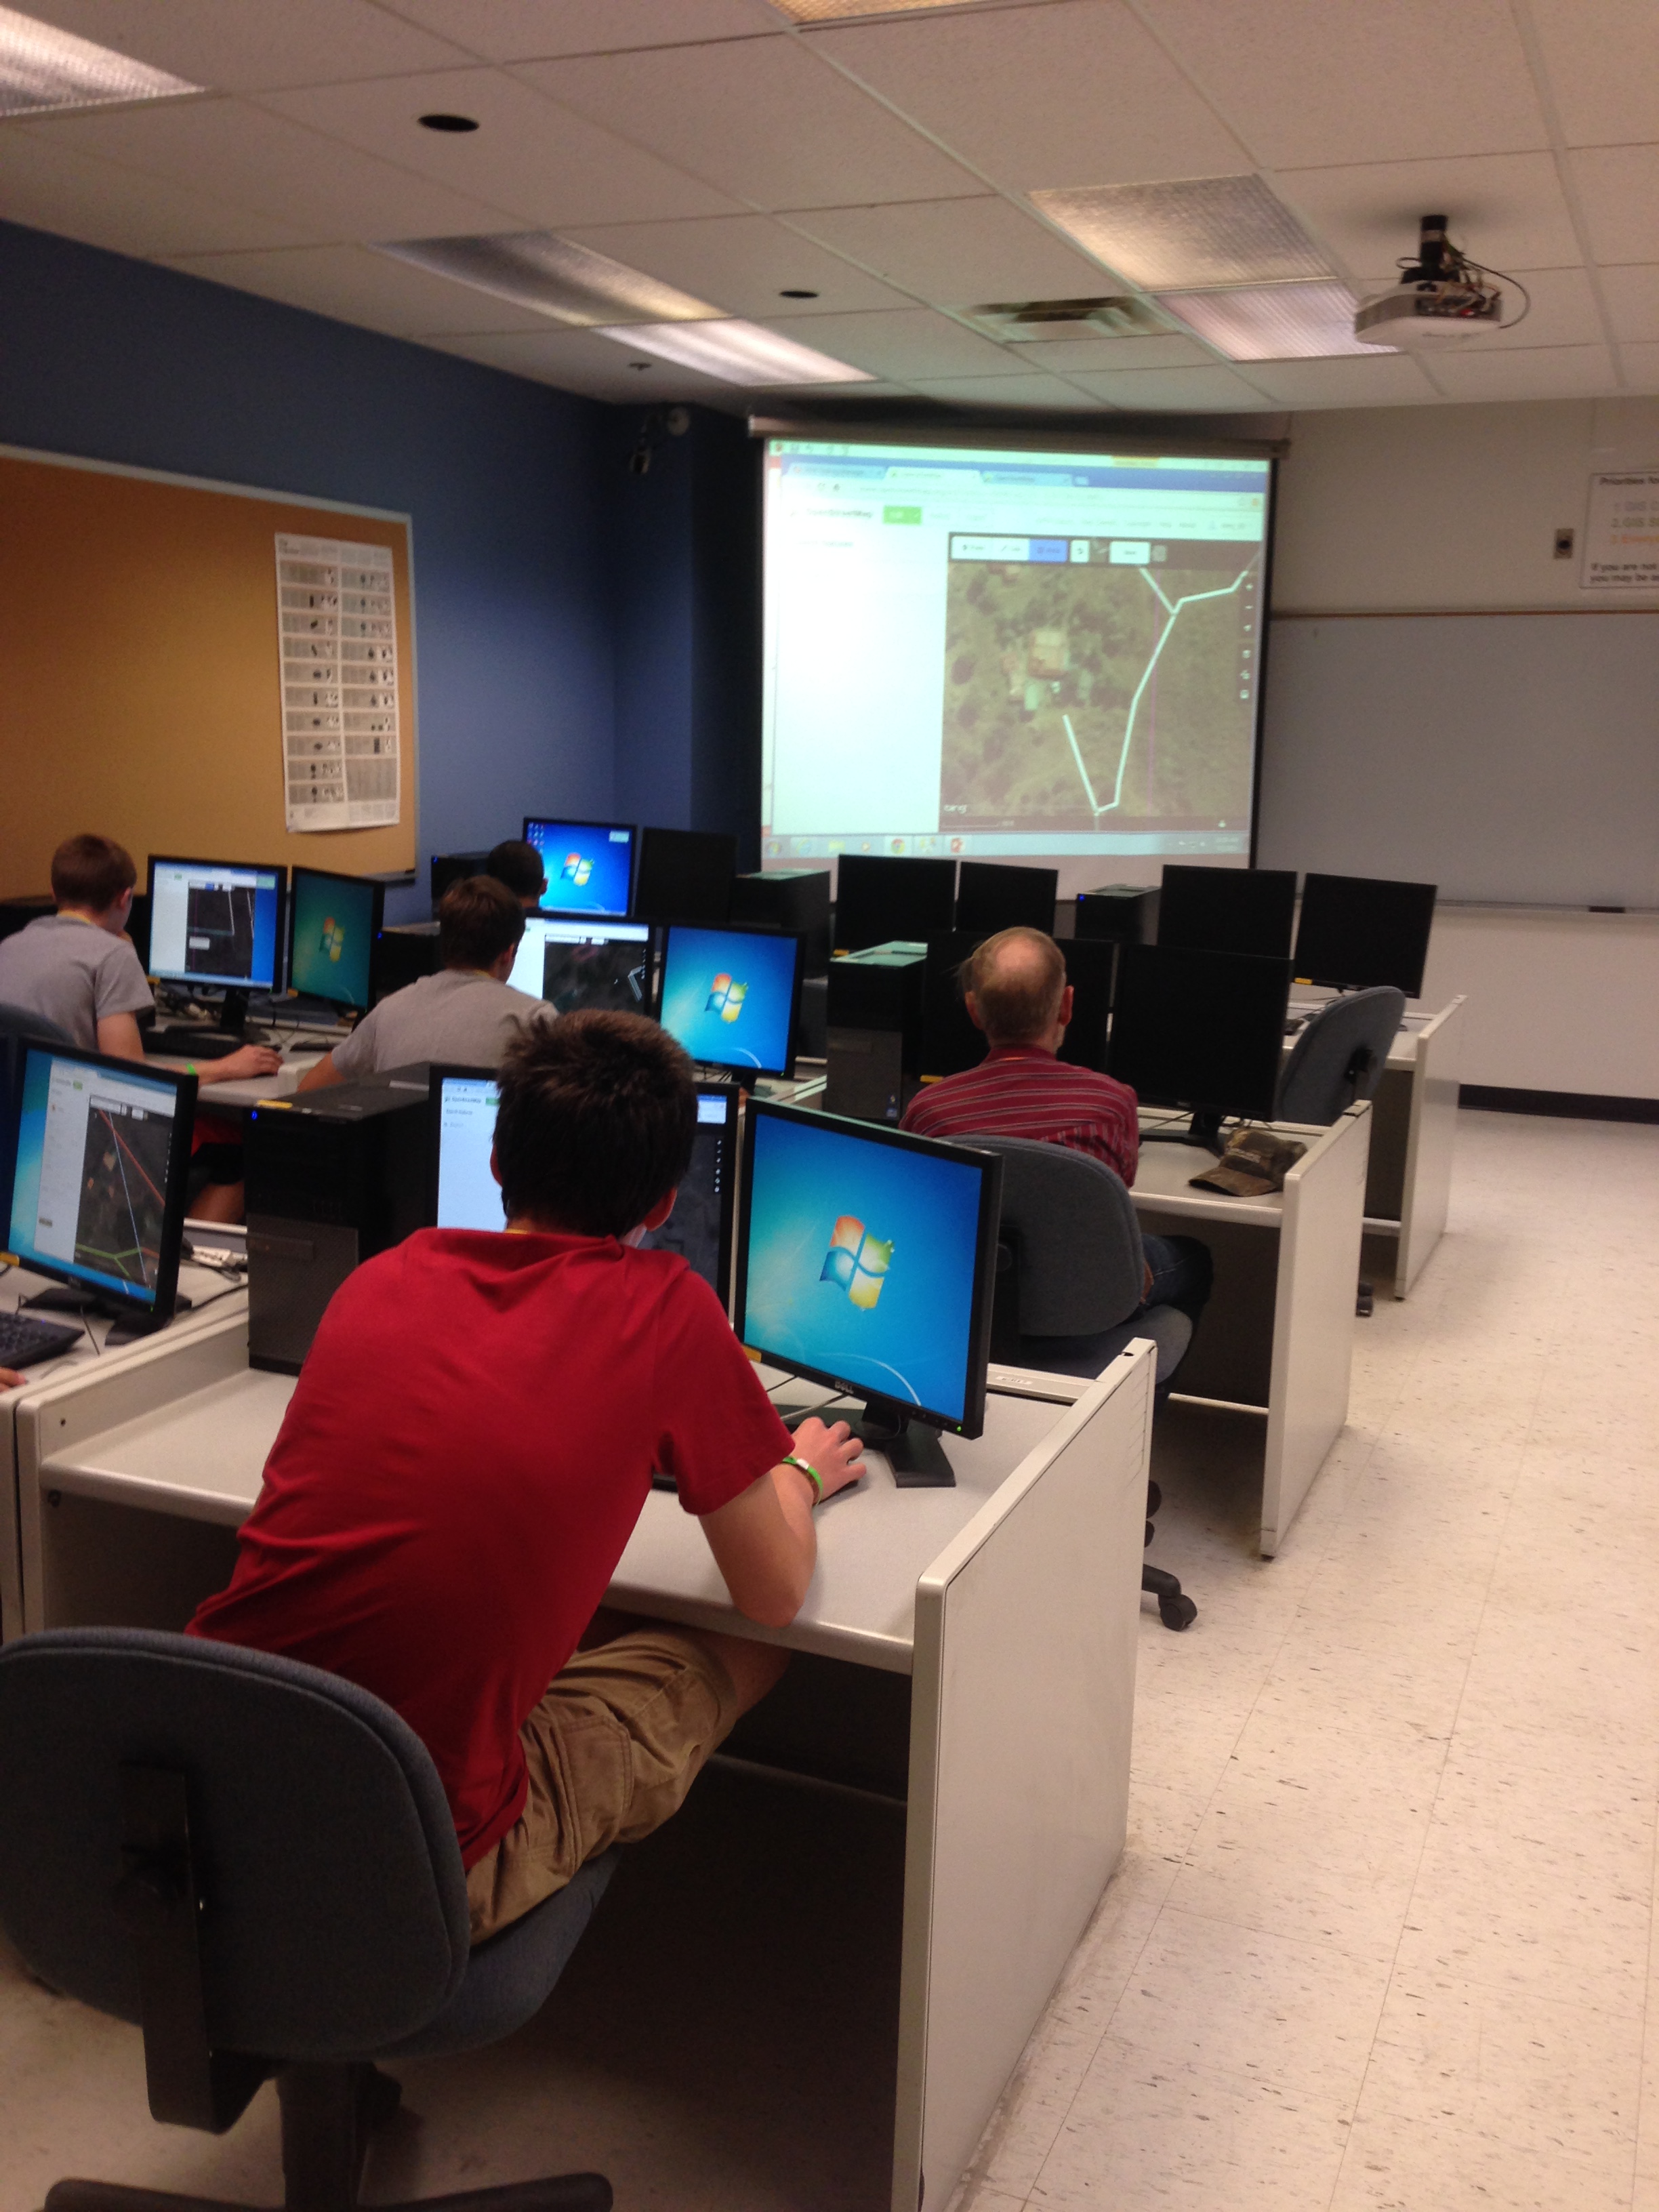
To ensure all students could begin mapping upon arrival at the workshop, we created twenty ‘dummy’ OSM accounts to provide them at the beginning of the session. These accounts allowed us to monitor the students’ progress, while helping to keep them on task and working with the group as a whole.
Workflow
To execute the first and second tasks, we created an introductory PowerPoint to define the fundamental concepts of mapping: from uses of GIS, to the origins of aerial imagery and remote sensing. Hoping to trigger the students’ curiosity, we employed an array of exciting imagery and varied descriptions of field applications. Finally, we showed them the video “Why Map?” on the MapGive website.
For the third tasks, students were asked to begin digitizing the features of a small, unmapped town: Ogden, Iowa. This step was intended to adjust students to working remotely, providing them with high-resolution imagery and a familiar landscape. Using the teachOSM tasking manager, the town was sectioned into small, manageable areas. The trainer presented additional PowerPoint slides and a live demonstration explaining; how to create lines, points, and areas; and label and save after each edit.
Students were asked to spend the first half of the mapping session learning to digitize streets, waterways, houses, and parks for Ogden. After thirty minutes, they transferred to the humanitarian area provided by the HOT tasking manager in Namaacha, Mozambique, where they continued to map for the remainder of the session.
Problems
Fortunately, we encountered very few problems during the workshops. Most students participated readily, and the creation of extra accounts guaranteed no issues with the opening process. Our final review indicated that some students squared or rounded areas, while others did not, resulting in uneven mapping quality between users. A few students working in blocks on the edge of town extended beyond their intended boundary and mapped surrounding farm fields, and a mischievous student drew an imaginary lake in Ogden and several non-existent triangle buildings: quite the surprise for our final editor.
Results
Though this was our third OSM/MapGive workshop, it was our first time using the teachOSM task manager. We feel that the similarity between the teachOSM and HOT mapping interfaces provided organization as we transitioned the students from the former to the latter. The lock-area tool enabled us to delineate areas for individuals to work in, preventing duplicate edits, while providing a manageable area for completion.
To track workflow and understand how well students learned to map in our allotted time period, we analyzed the number of features created; per account, per day, per area. In total, students seemed to take to mapping quickly; creating an average of 51 features each (some mapping only a few, some mapping as many as 120 features). The comparison between edits in Iowa to Mozambique revealed that most students mapped areas of the humanitarian effort more proficiently than they did the town in Iowa, indicating either improved skill or increased interest. In total, students mapped 1031 features over the two-day period.
As a bonus, some of the students commented regarding the differences between the imagery from their state of Iowa, to the HOT area in Namaacha, Mozambique. They became attentive to differences between the sizes of housing, quality of roadways, and other features on the landscape. Though our intent was to introduce students to mapping and online humanitarian efforts, we accomplished yet another wonderful feat: teaching students more about the world around them.