EARTH WEEK 2017: Iowa State Activities
Here is a list of highlighted activities that are going on at Iowa State University for Earth Week.
For more details – follow this link: http://www.livegreen.iastate.edu/news-and-events/earth-month#earthweek
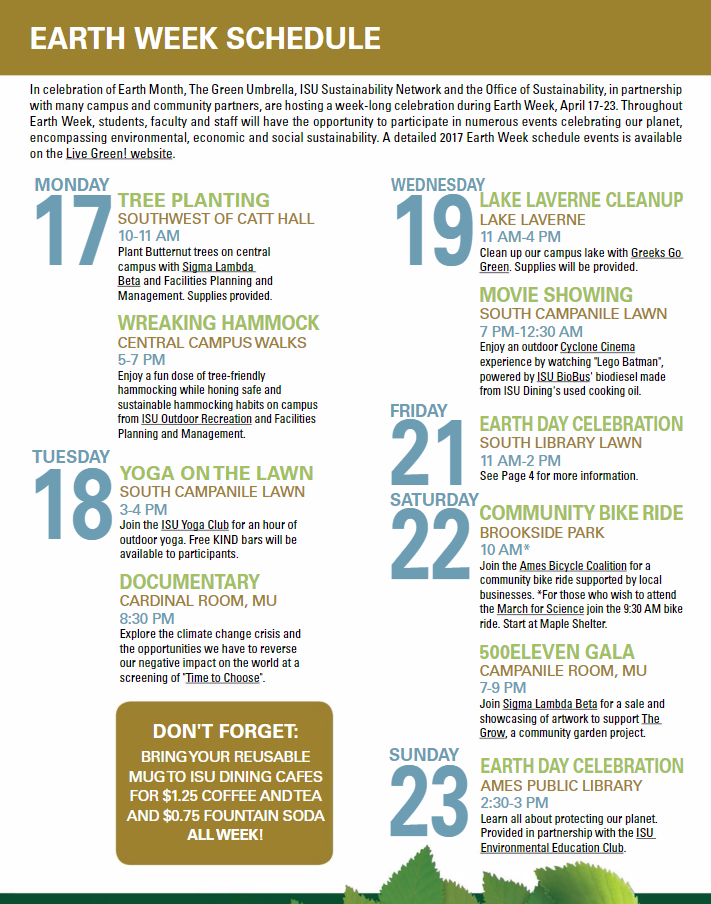
Here is a list of highlighted activities that are going on at Iowa State University for Earth Week.
For more details – follow this link: http://www.livegreen.iastate.edu/news-and-events/earth-month#earthweek

Happy Earth Week! This year NASA has created unique opportunity just in time for Earth Day for interested participants to “Adopt the Planet.” There are 64,000 locations available from adoption.
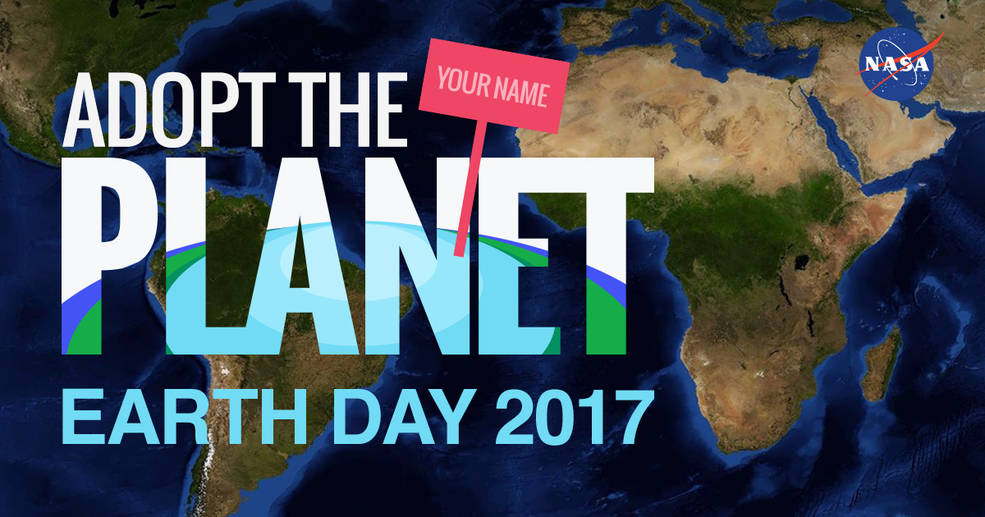
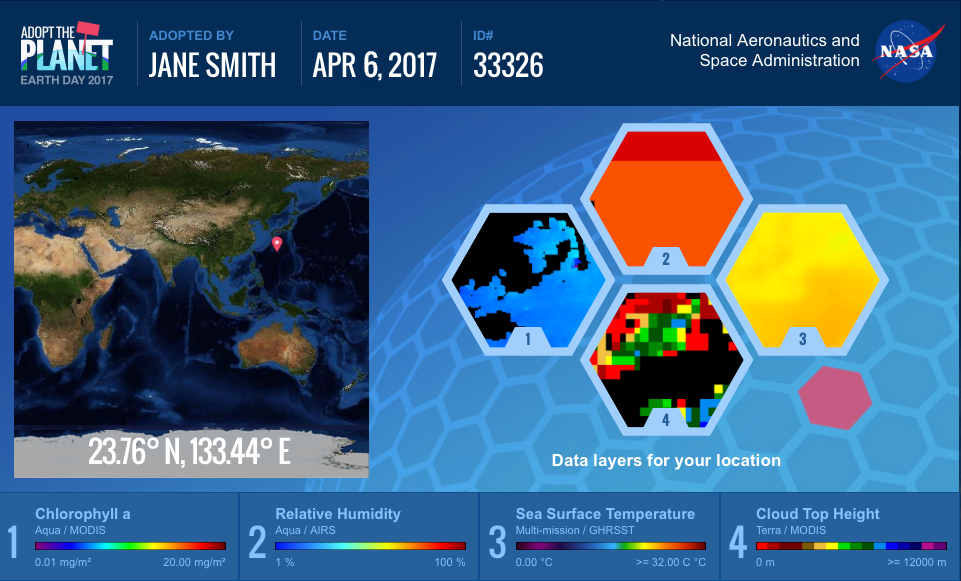
When you visit the website you can fill in your name and then receive a certificate with your adopted patch of Earth. The adoption certificate gives you specific coordinates of your location on our globe as well as satellite data layers relevant to your piece of Earth. You can use WorldView, NASA’s web-based satellite viewing application, to explore your adopted point over time and with different layers.
I received a point on the coast of Antarctica. It was cool to explore a part of our planet that I don’t normally think about on a daily basis. With the WorldView application I was able to see how it changes over the seasons from solid ice to open ocean. WorldView even has the ability to animate these observations.
This outreach event allows us the appreciate our planet from space and helps us learn about some of the space instruments that are continuously monitoring and circling our planet.
The ISU GIS Facility recently rolled out a new website (http://www.gis.iastate.edu/gisf/projects/conservation-practices) that allows users to download completed data sets from the Iowa BMP Mapping Project. Each file geodatabase contains 6 mapped conservation practices: contour buffer strips, grassed waterways, stripcropping, pond dams, terraces, and WASCOB (water and sediment control basins.) The website also allows visitors to preview the data available in the file geodatabases by downloading a pdf. Please use this valuable resource.
Thanks to everyone who visited the Earth as Art exhibit. We hope you enjoyed it! It was so encouraging to have some many visitors! Over 275 people signed the guest book. We had great walk-in traffic as well as visits from the Boy Scouts, 4-Hers, ISU’s Emerging Writers, members of the Ames Community Arts Council, and a workshop on climate change.
Thank you to Brent Yantis for putting together this exhibit from the Earth as Art collections. Thank you for making the drive from Louisiana to Iowa and helping us get it installed!
Thank you to Gloria Oyervides for your beautiful work on the poster and other promotional materials. Thank you for your hard work on the educational materials and for helping with the installation and opening night.
Thank you to Xingyi Zhang for creating the world map with locations of the images and for help with installation and opening night.
Thank you to the Design on Main gallery, Kyle Renell, and the interns for helping host our exhibit!
Come one, come all – to the final weekend of the Earth as Art exhibit.
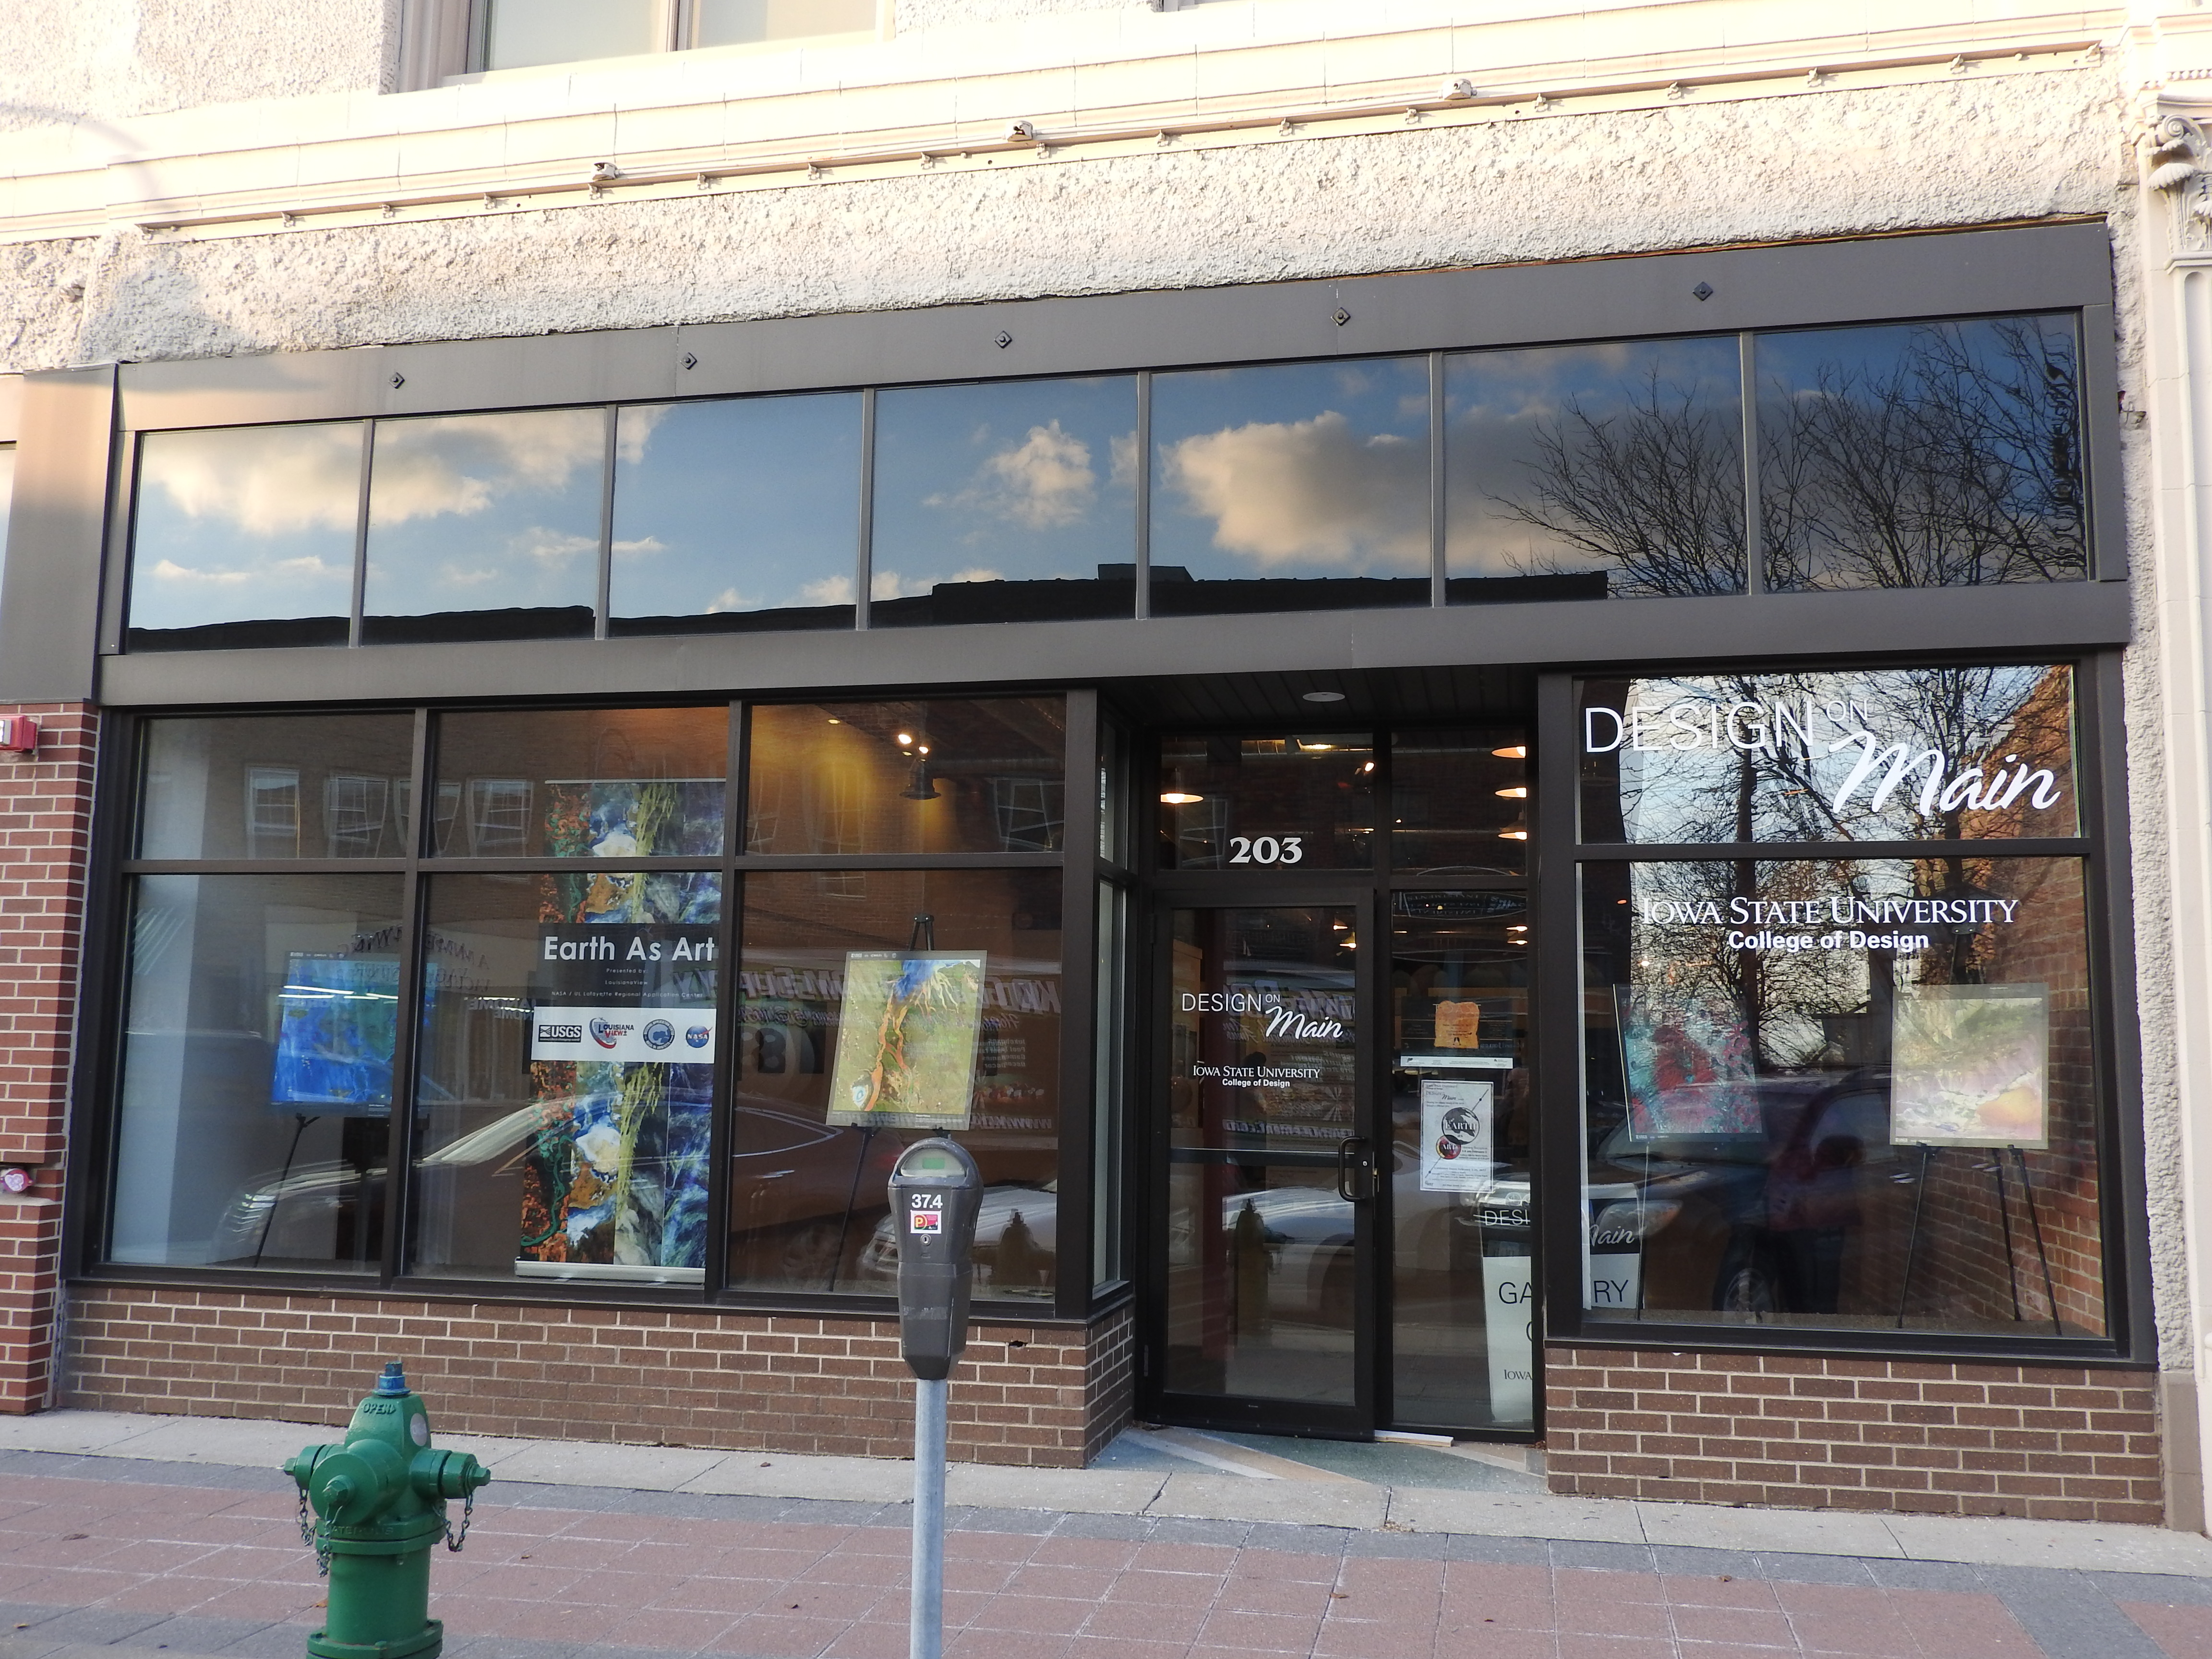
Design on Main – 203 Main Street – Ames, Iowa
Hours:
Thursday 4-7pm
Friday 2-5pm
Saturday 11am-5pm
Sunday 2-5pm
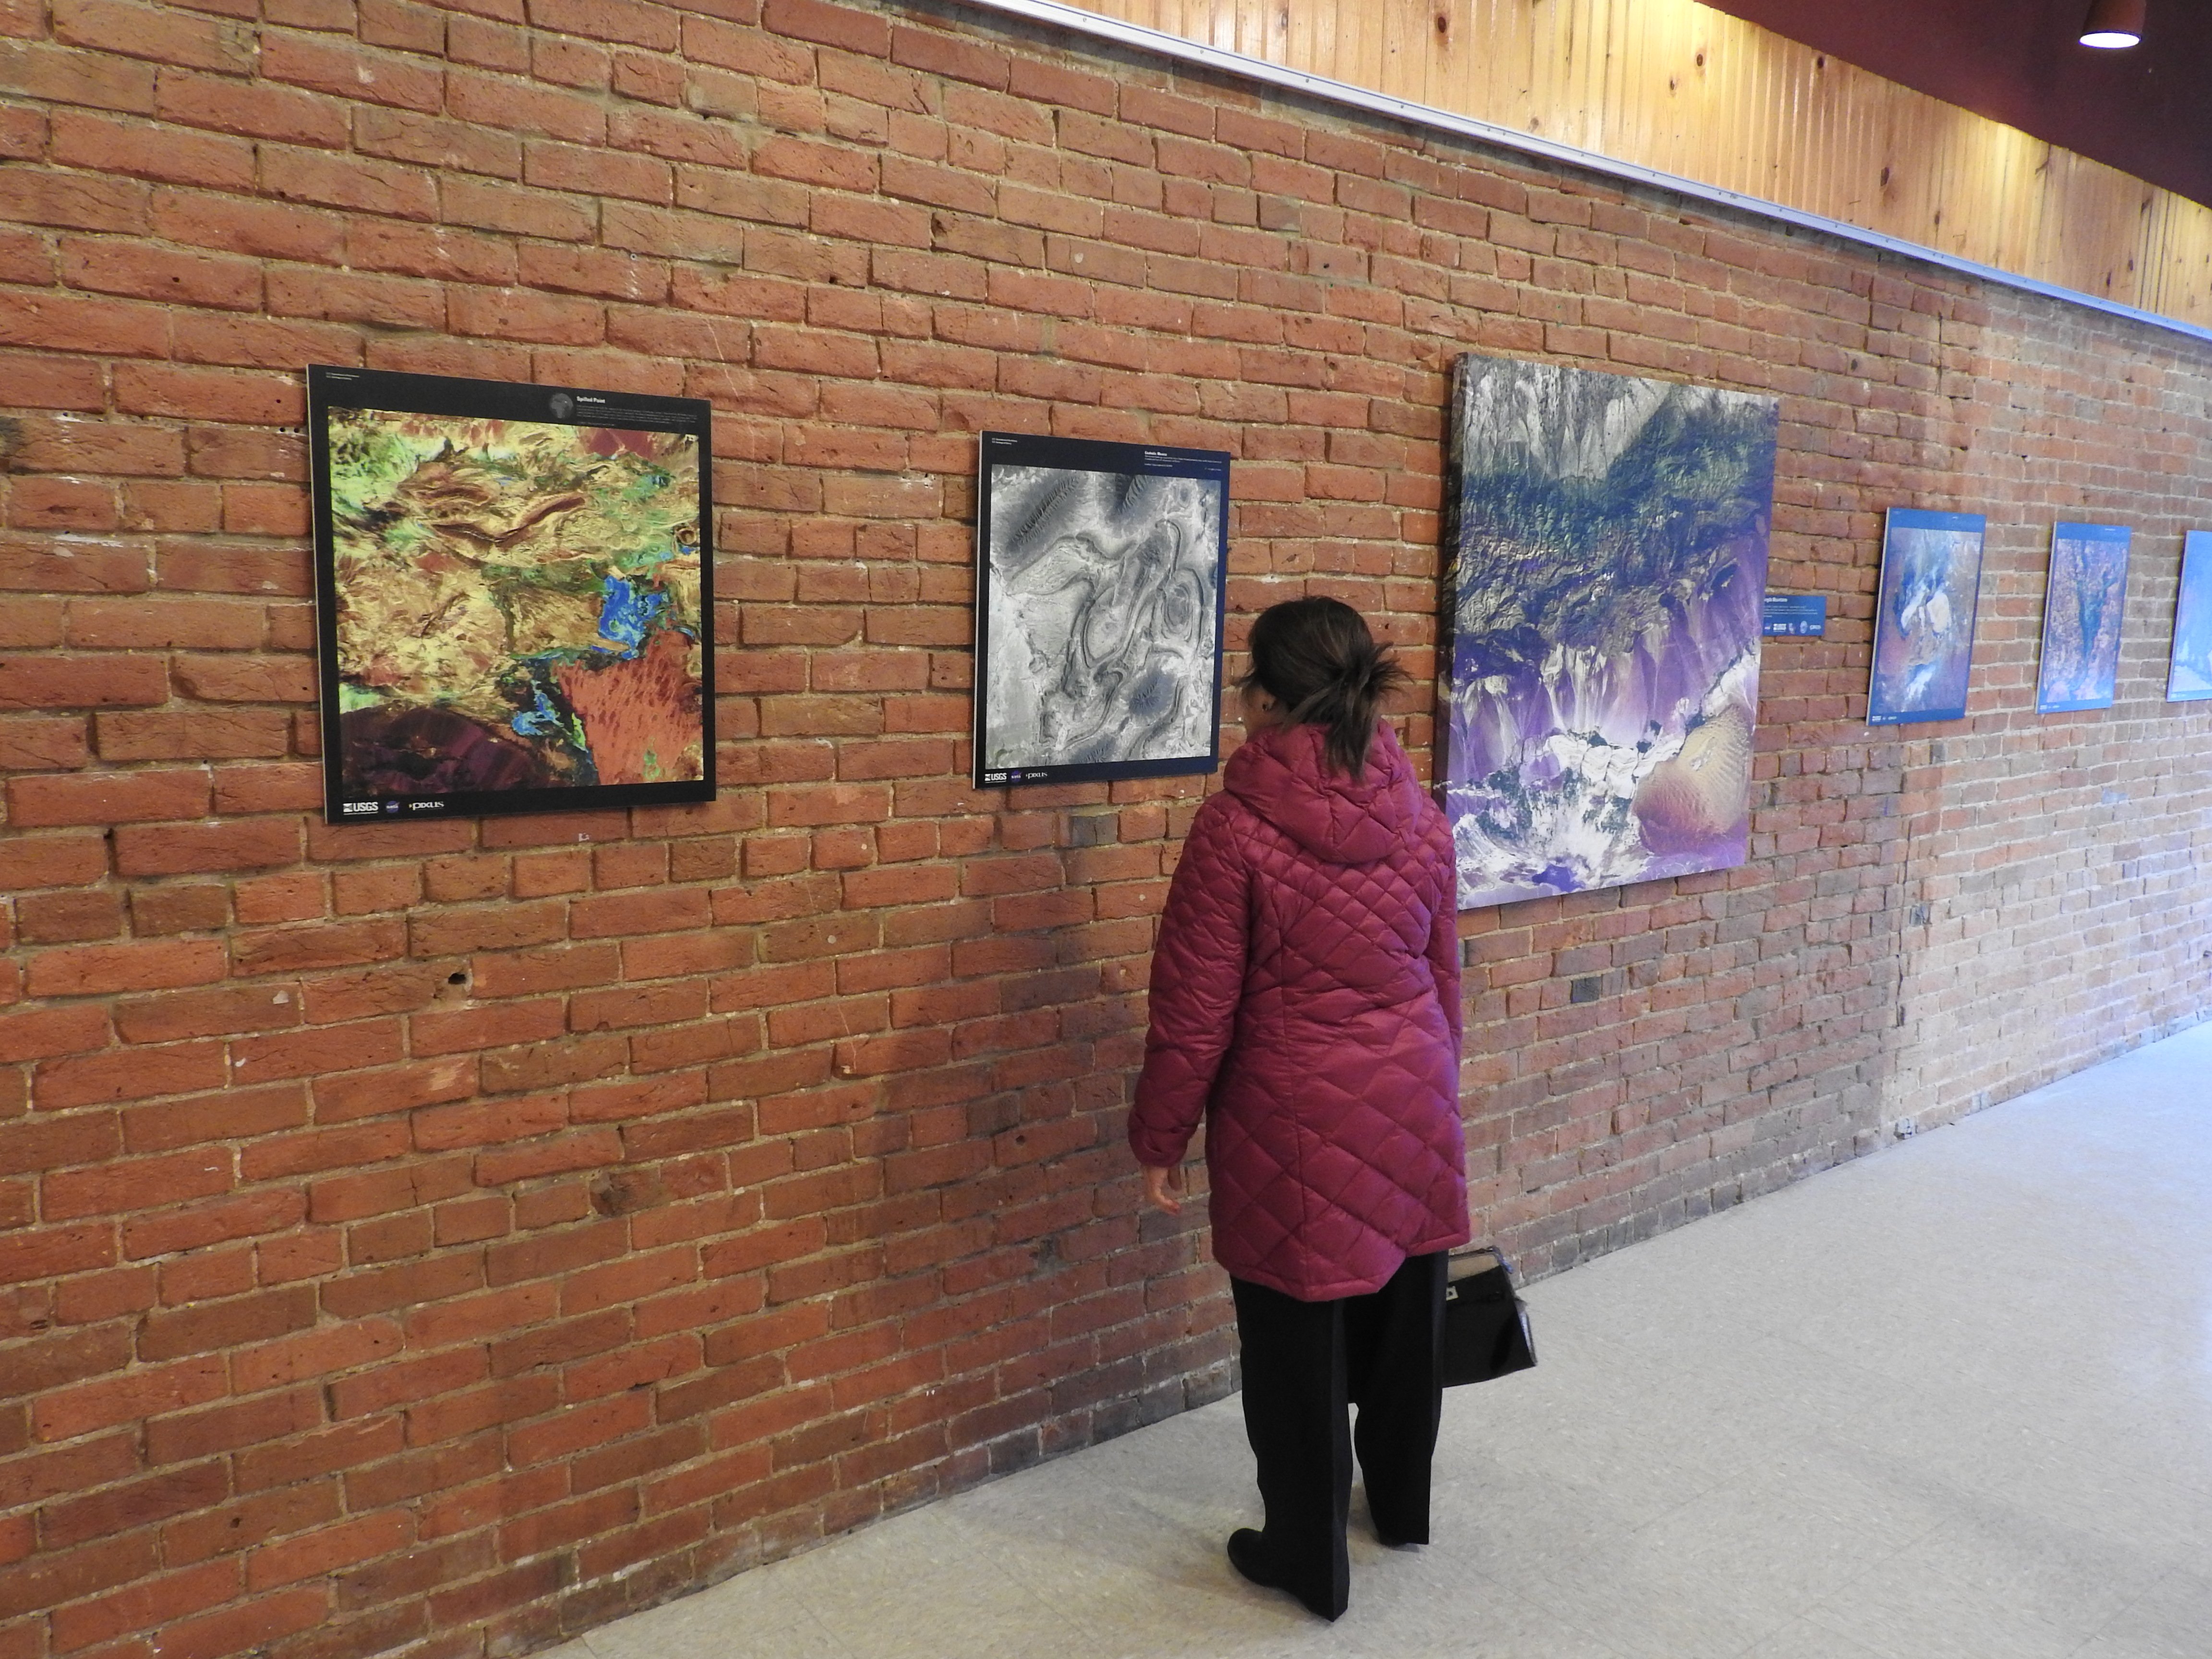
Richat Structure – geological formation in the Maur Adrar Desert in the African country of Mauritania. Although it resembles an impact crater, the Richat Structure formed when a volcanic dome hardened and gradually eroded, exposing the onion-like layers of rock.
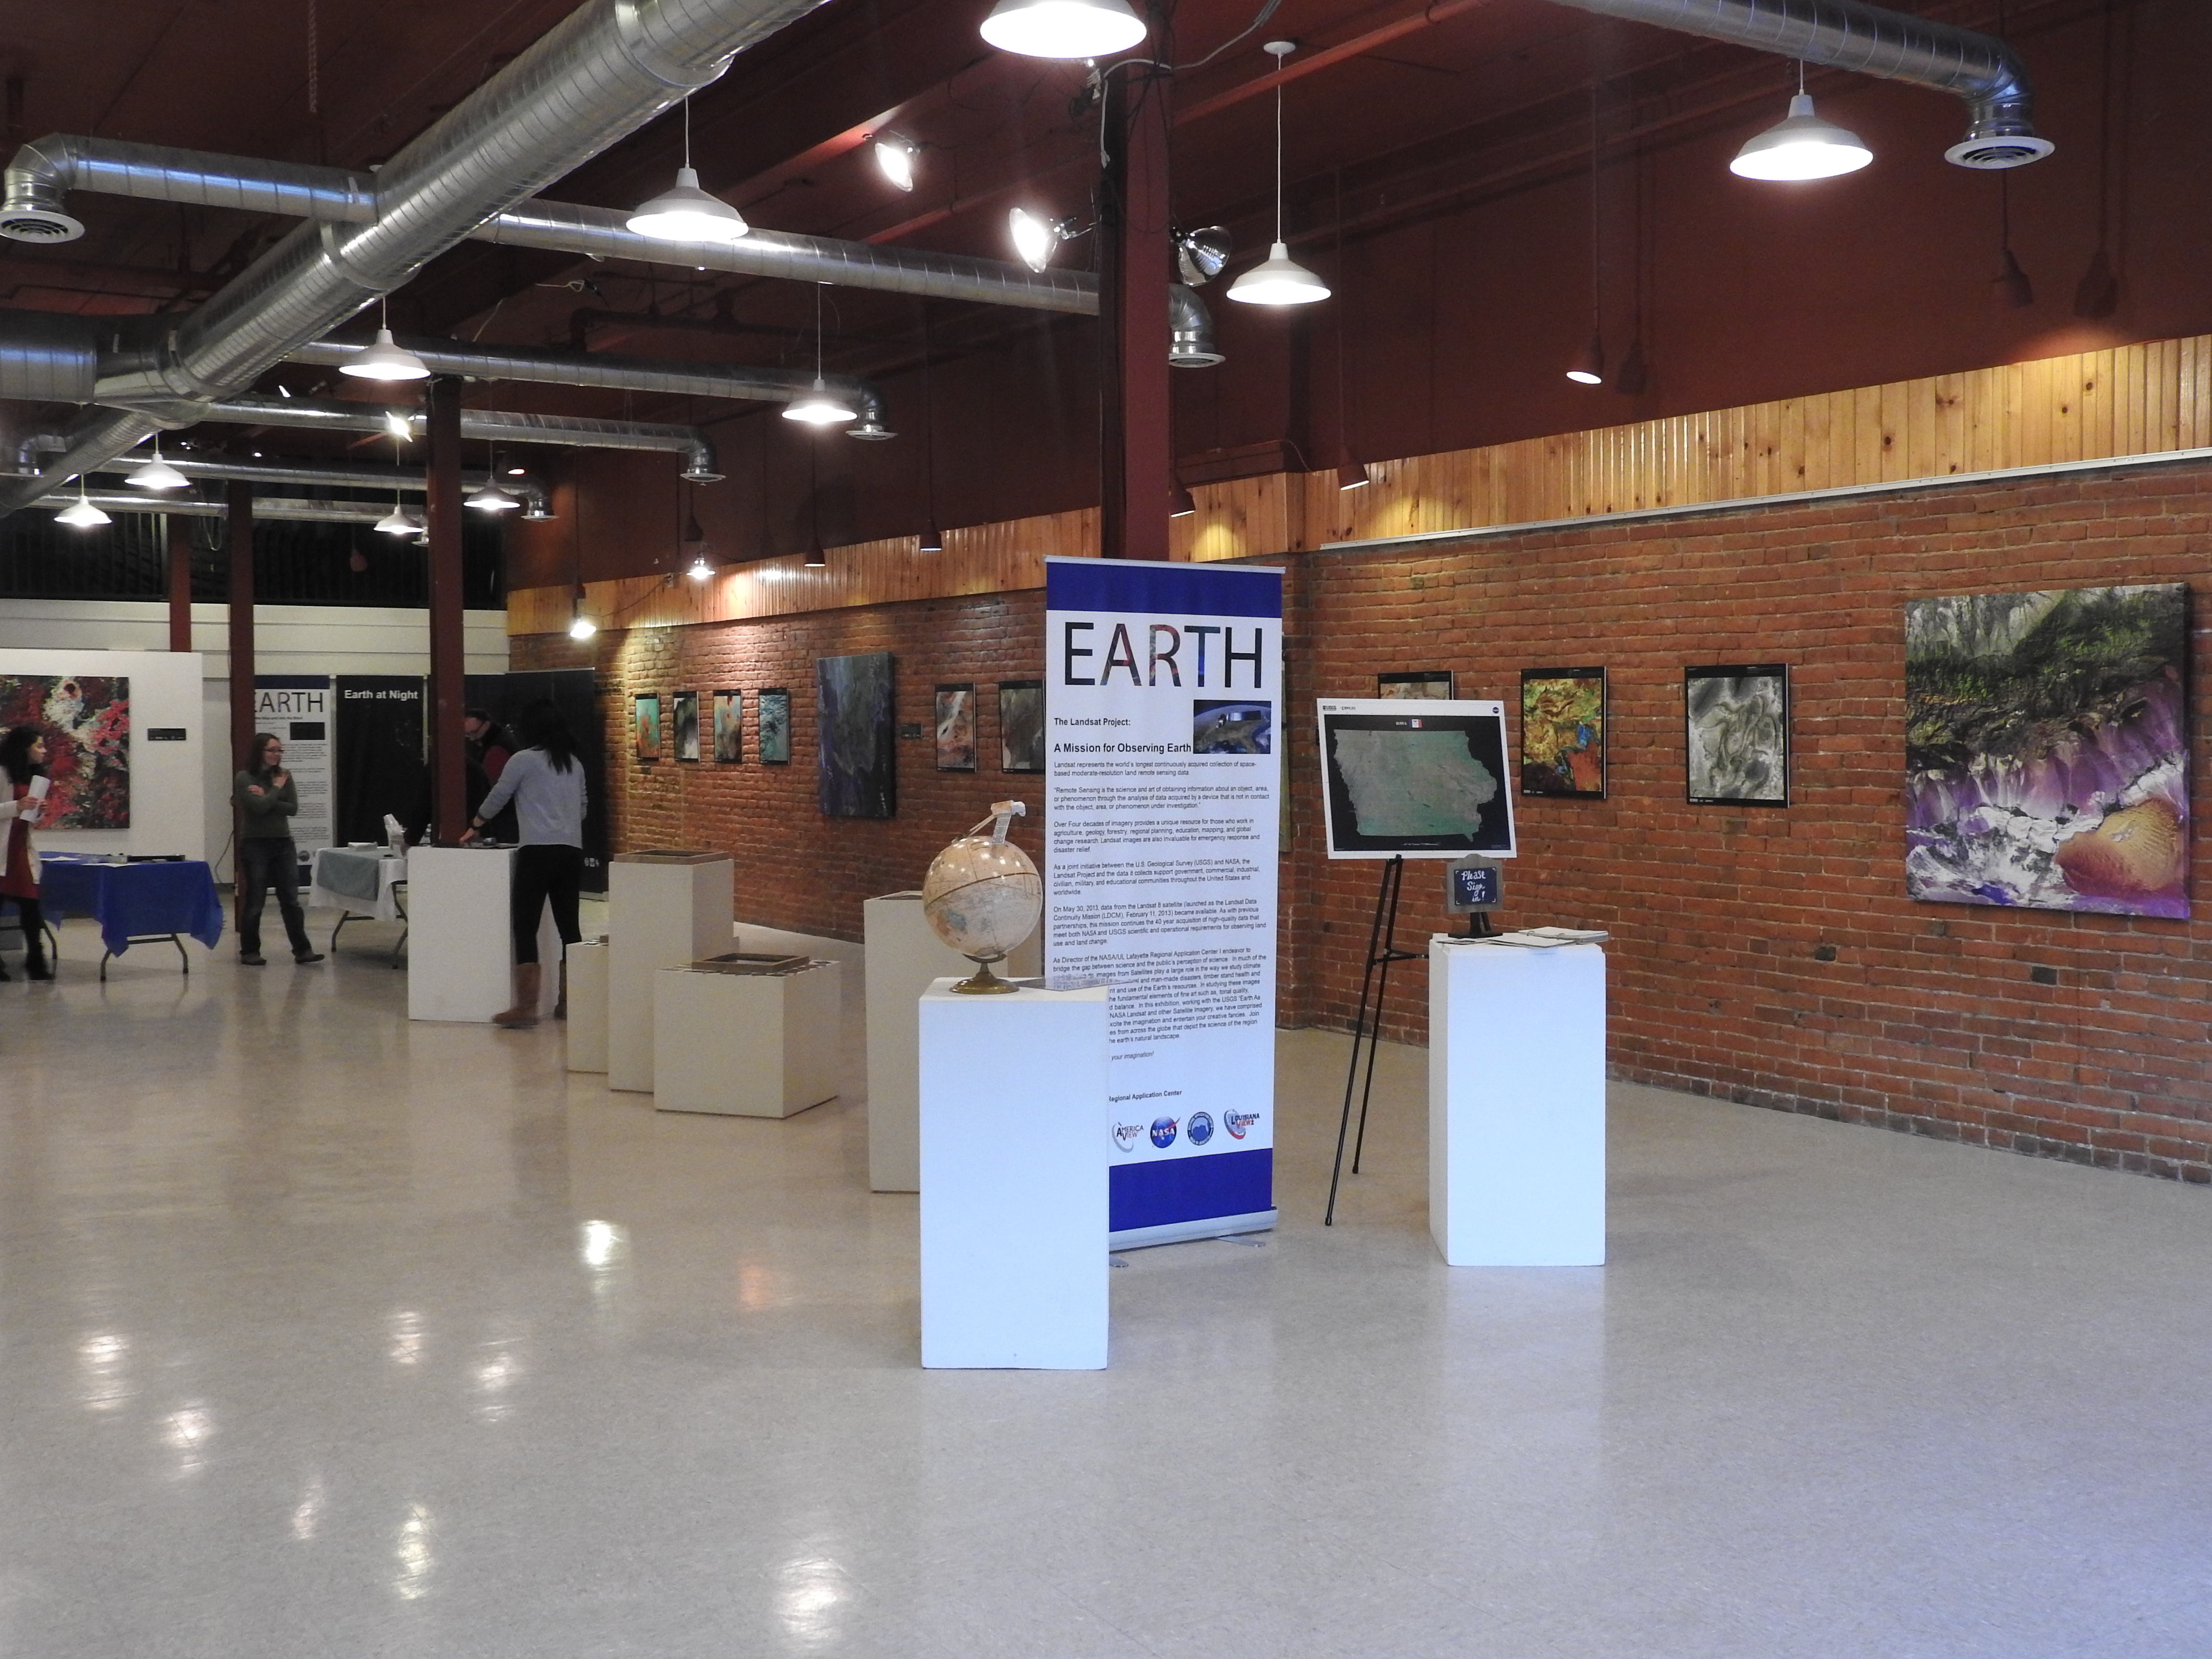
 Don’t miss your chance. This is a unique opportunity to see a melding of art, science, geography, and technology here in the Ames community. Come see some great art.
Kids and adults can stop in to make a color wheel or model of a Landsat satellite or search the images to complete the scavenger hunt. The exhibit is running through Sunday, February 26, 2017.
Hours:
Thursday 4-7 pm; Friday 2-5 pm; Saturday 11 am -5 pm
Sunday Feb 19 & 26, 2-5 pm
Read more about the exhibit HERE.
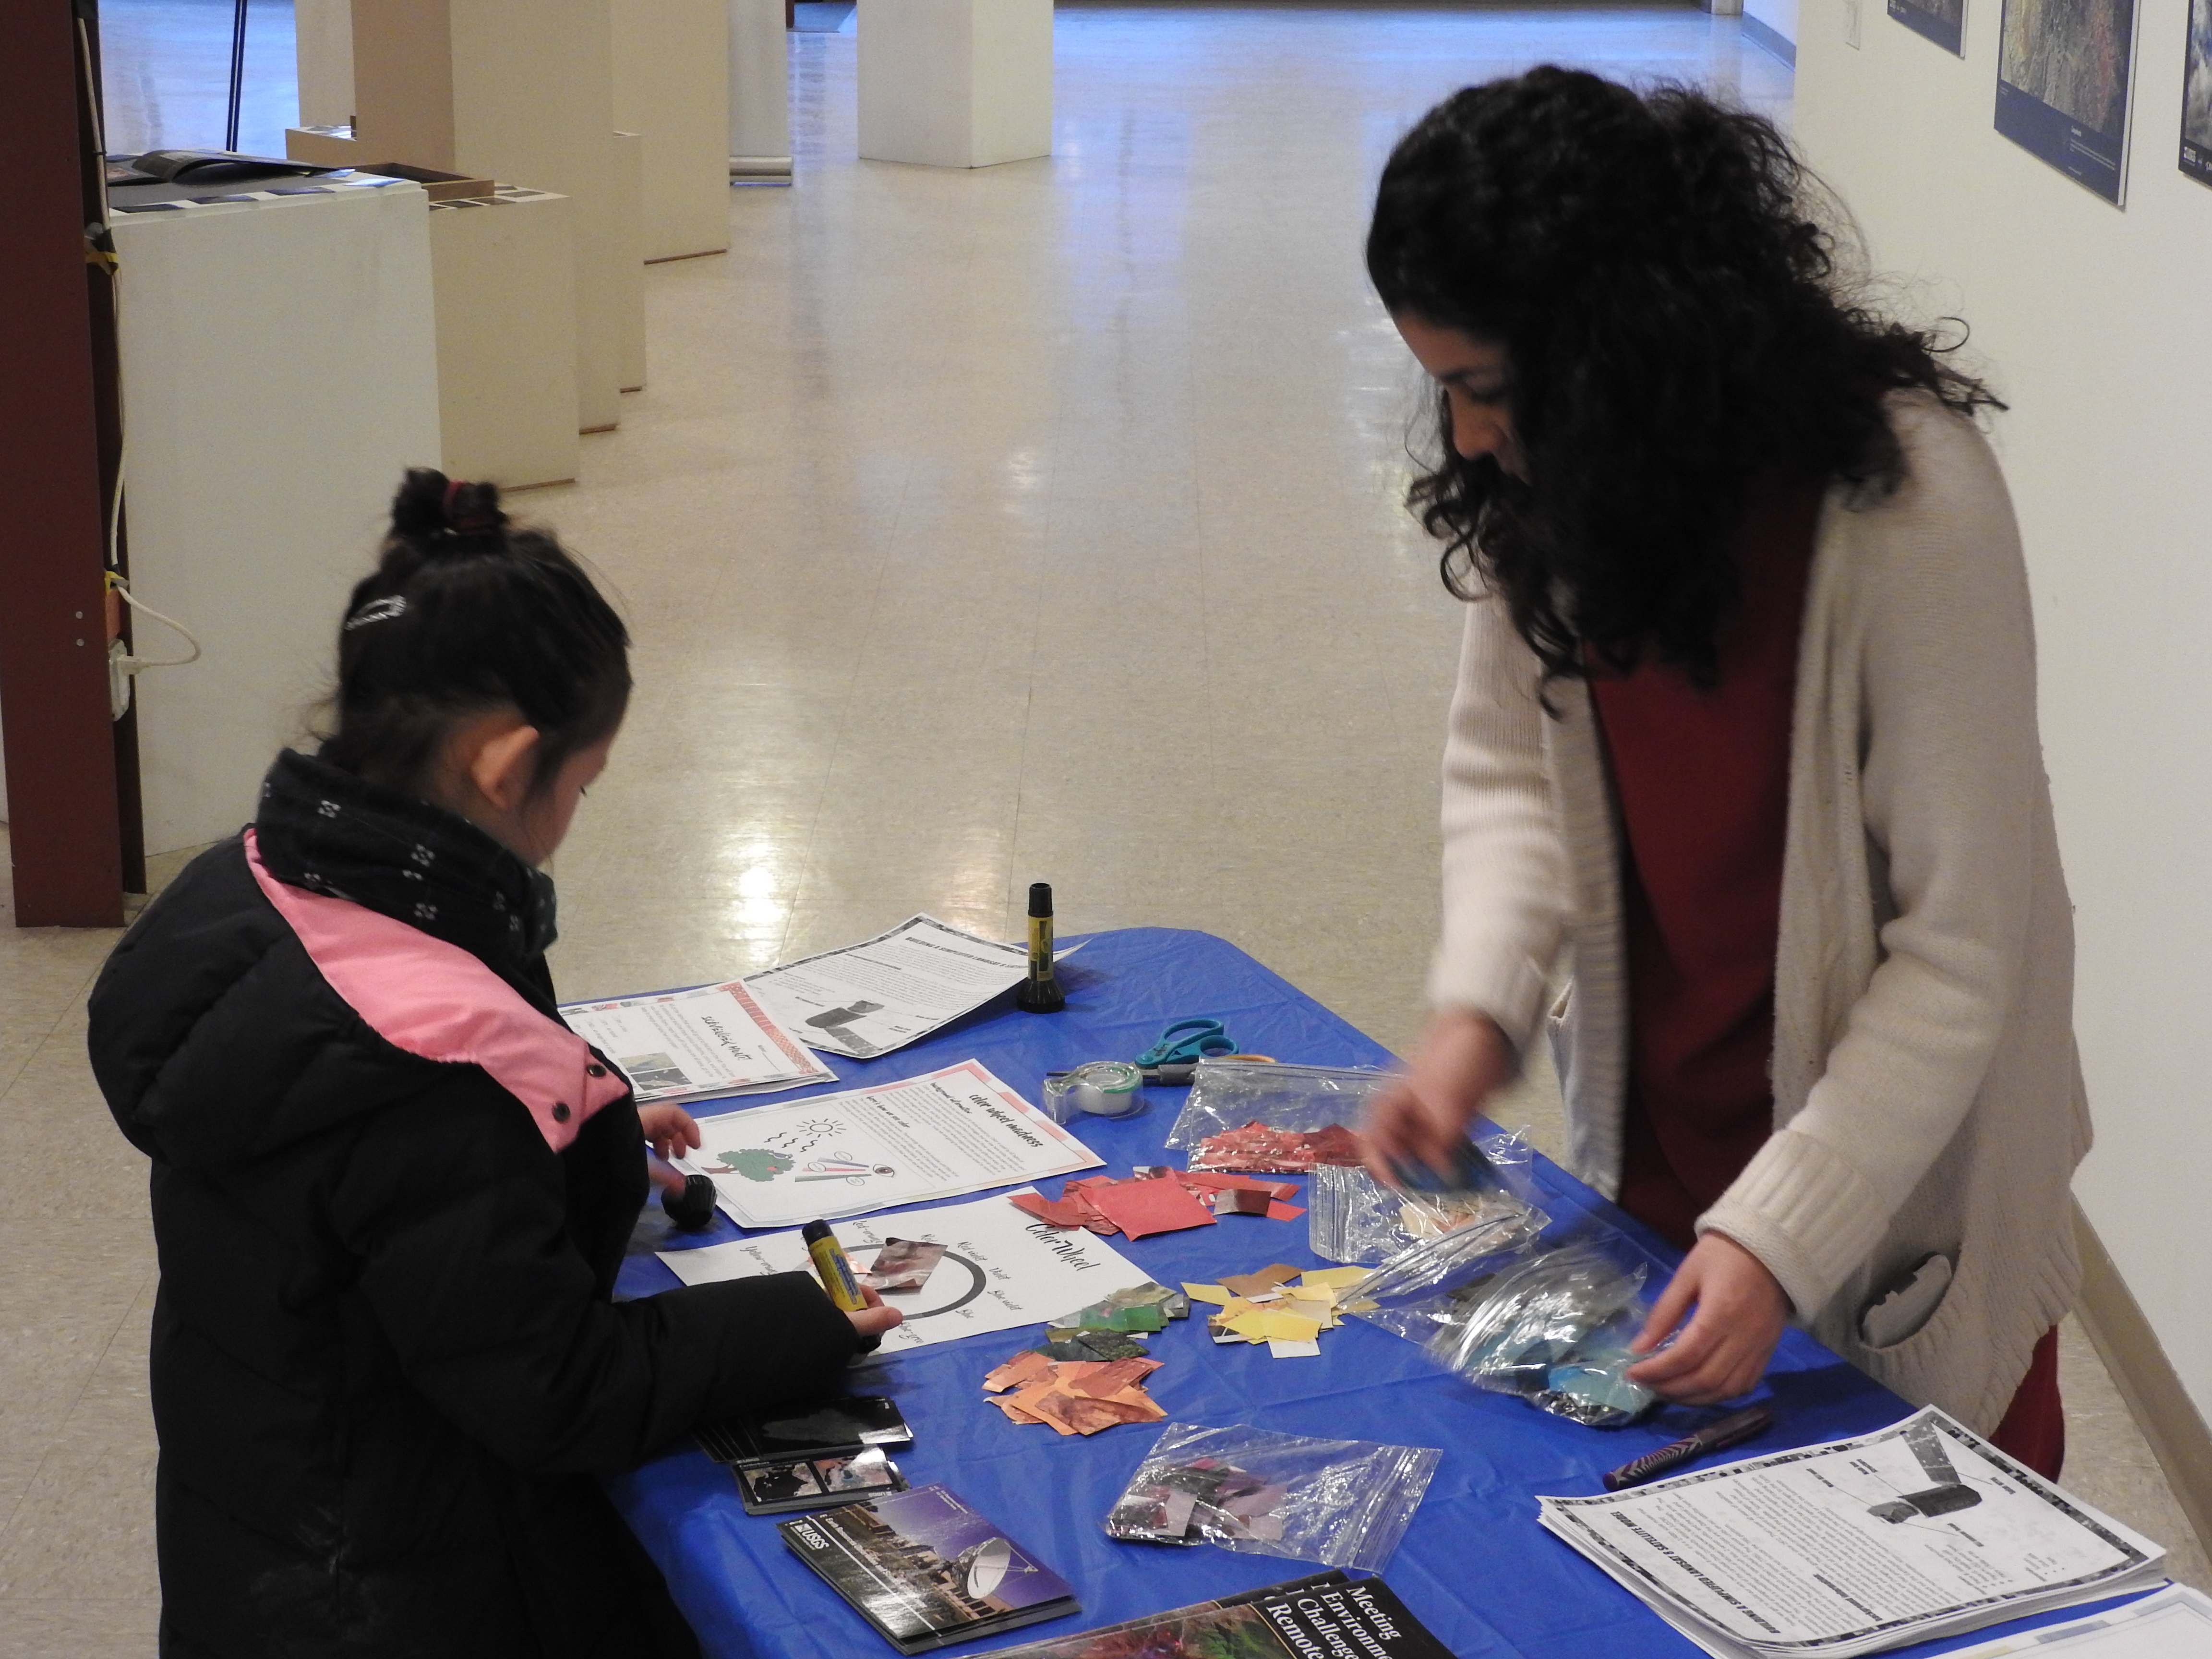
The opening reception for the Earth as Art exhibit is on February, 2, 5-8pm. Several younger visitors were in attendance. They created model satellites, color wheels, and searched the gallery to complete the scavenger hunt. There was gallery talk at 6:30 pm by Brent Yantis, the LouisianaView director and the exhibit collection curator, he explained how the images were selected and shared some of his favorite images with us.
There was a reception of crudites and cheese as well as a King Cake that was brought from Louisiana. The King Cake tasted like a cross between a glazed doughnut and a cinnamon roll, filled with chocolate and cream filling. LouisianaView and IowaView are part of the larger AmericaView, nationwide consortium for remote sensing education, research, and geospatial applications.
IowaView and ISU GIS Facility will be hosting an art exhibit in the Design on Main gallery in February. It will be a unique exhibit that is a fusion of art and science – we hope that the exhibit will inspire viewers with beautiful images from around our planet and also provide a platform for education (satellite imagery, geography, earth science, physics, and art.)
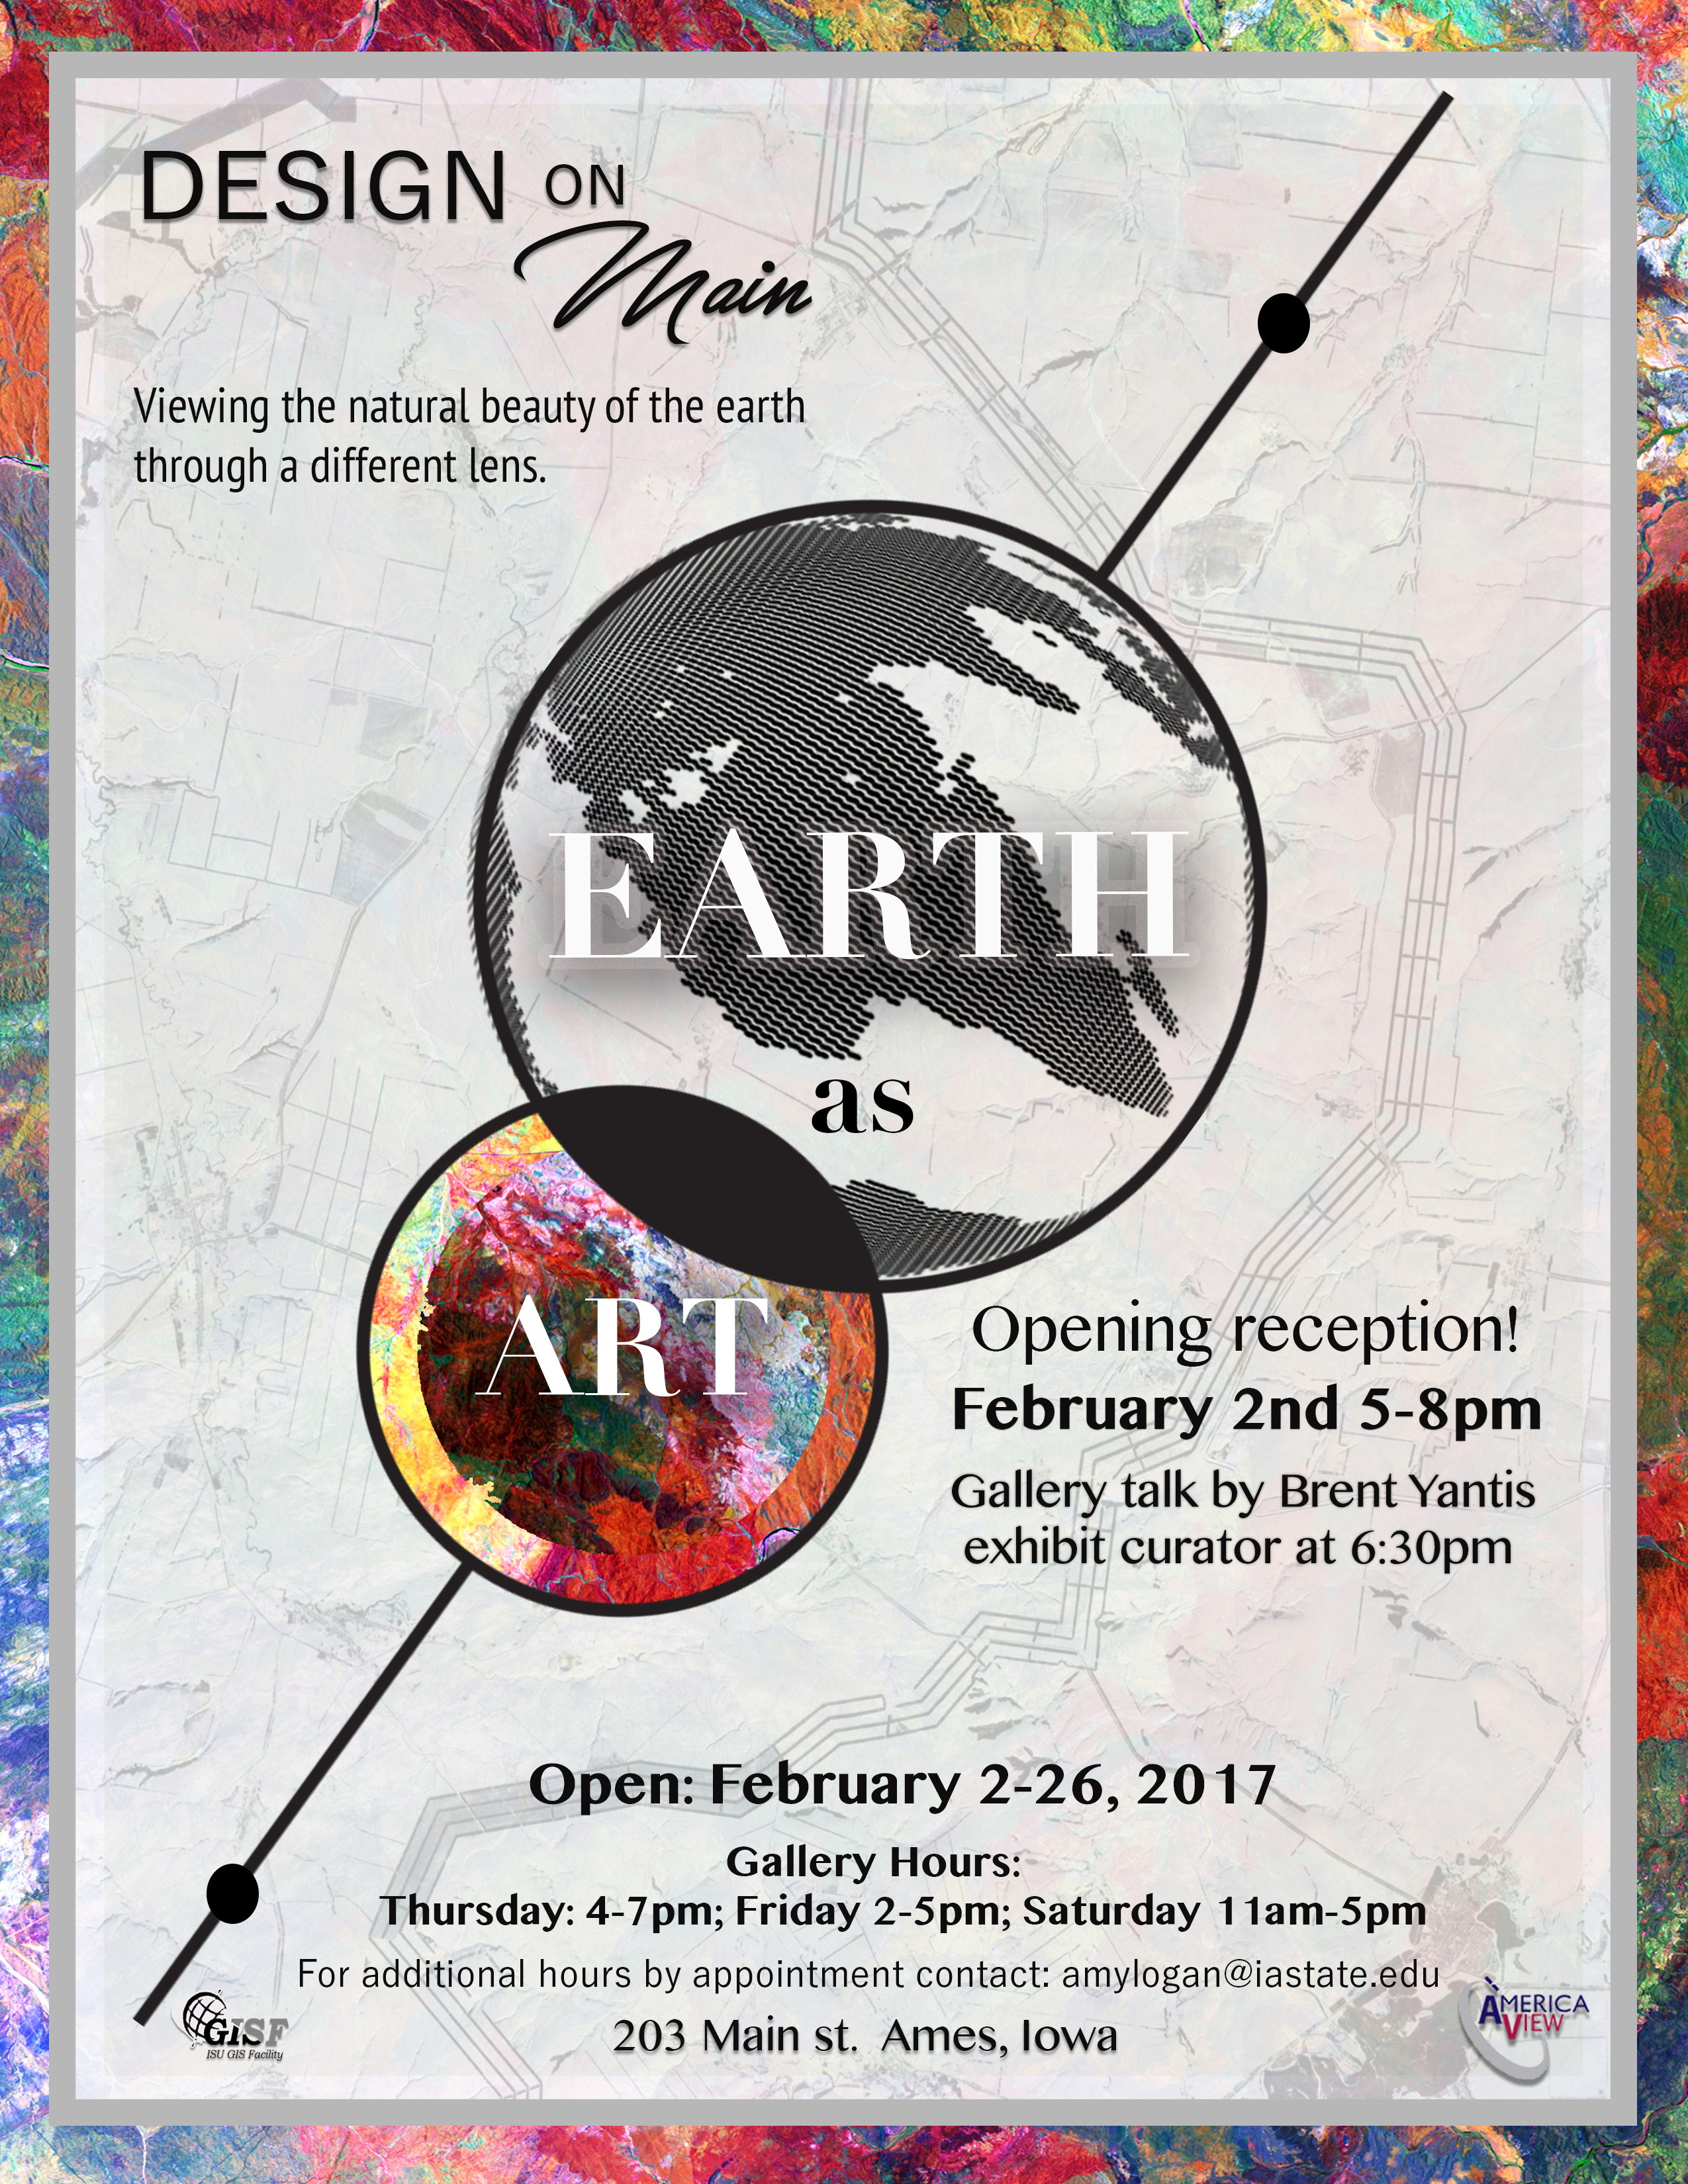
The opening reception for the exhibit is on February, 2, 5-8pm. We are planning to have a gallery talk at 6:30pm by Brent Yantis, the AmericaView collection curator as well as refreshments. AmericaView is a nationwide consortium for remote sensing education, research, and geospatial applications. For additional details visit our Earth as Art exhibit page.
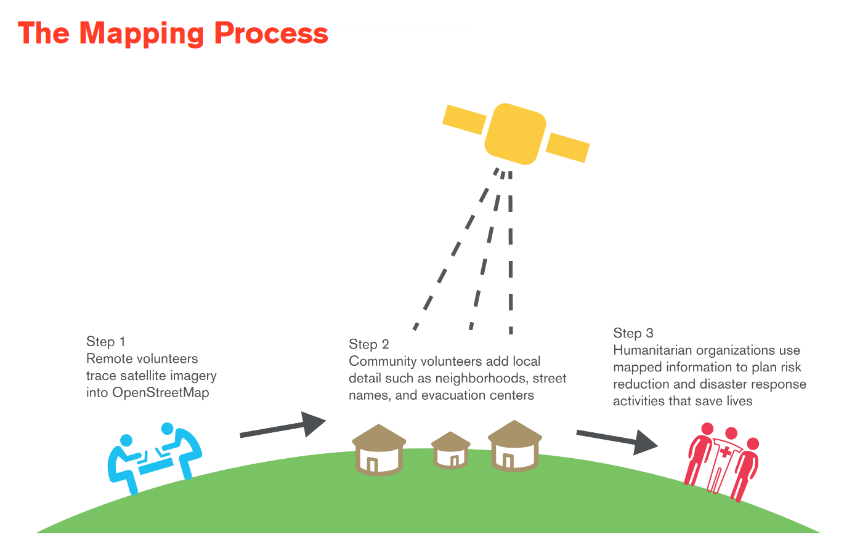
This is a fun service project. Come meet some new people, do some good (mapping) and eat pizza!
MLK Jr. Day OSM Mapping Party Monday January, 16, 2017 from 10 am to 1pm, Durham 206 –
Please RSVP: iowamapgive@gmail.com.
Click here for more information.